á1181ñSCANNING ELECTRON MICROSCOPY
Scanning electron microscopy (SEM)is an electron optical imaging technique that yields both topographic images and elemental information when used in conjunction with energy-dispersive X-ray analysis (EDX)or wavelength-dispersive X-ray spectrometry (WDS).SEMis useful for characterizing the size and morphology of microscopic specimens.Together,image and X-ray analyses are important for the identification of small particles.Elemental analyses using SEM/EDXor SEM/WDSare useful for qualitative and semiquantitative determination of elemental content.Accurate quantitation is possible only for bulk samples with smooth surfaces and thus is not practical for particle specimens.
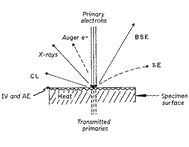
Typically,SEManalysis requires a small amount (10-10to 10-12g)of a solid specimen that is coated with a conductive substance to inhibit sample charging.The sample is placed in an evacuated chamber and scanned in a controlled raster pattern by an electron beam.Interaction of the electron beam with the specimen produces a variety of physical phenomena that,when detected,are used to form images and provide elemental information about the specimen.These phenomena include (1)emission of secondary electrons (SES),(2)reflection of backscattered electrons (BSES),(3)characteristic X-ray emission,(4)emission of Auger electrons,(5)cathodoluminescence (CL),(6)conduction of current,(7)charging from induced voltages (IVS)or adsorbed electrons (AES),(8)electron transmission,(9)heat generation,and (10)electromotive forces (see Fig.1).
Of these,SESand BSESare the most important for constructing SEMimages,and X-ray emission analyses are the most common methods for detecting the presence of particular elements.Use of ancillary instrumentation to detect the variety of phenomena other than (1),(2),or (3)above greatly increases the cost and complexity of the SEMsystem and will not be addressed here.
ELECTRON BEAM–SAMPLE INTERACTION
Imaging—
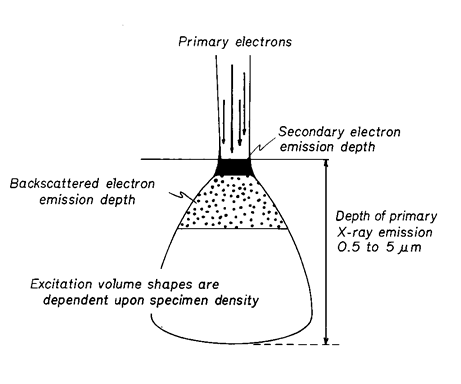
Images are formed in a SEMsystem by detection and manipulation of electrons.SEare emitted from a specimen surface as the result of inelastic collisions between primary (incident)electrons (PE)and electrons within a specimen.When the energy imparted to a specimen electron exceeds the work function of a sample,that electron is emitted as an SE.Most SEShave energies of 5to 20eV;electrons in this low-energy range can be efficiently collected,yielding high signal-to-noise images.Because such low-energy electrons can penetrate only short distances through the specimen,SESoriginate from within 2to 30nm of the surface and generate highly resolved images.The actual PESpenetration depth is dependent on PESaccelerating voltage,specimen elemental composition,specimen density,and specimen mounting angle.Excitation volumes of 0.5to 5µm in diameter are common.
Backscattered electrons are PESthat have been reflected from the sample.The PEScan undergo multiple collisions prior to exiting from the specimen;therefore,BSEShave energies over a broad range and emerge from relatively deep penetration (@0.1to 5µm)(see Fig.2).
These high-energy (15to 25keV)BSESare collected less efficiently than SES,and they yield images with poorer resolution.The efficiency of BSESreflection is a function of the atomic number (Z)of the specimen atoms;thus,the contrast of BSESimages depends on elemental composition.The penetration depth of all electrons is affected by elemental composition,specimen density,specimen tilt,and incident beam energy (accelerating voltage).For example,the SEimages of sodium phosphate and zinc phosphate crystals are quite similar.However,the heavier nuclei of the zinc species produce more efficient BSEreflection and BSESimages with higher contrast.BSEimages of heavy-versus light-element phases,or mixtures of species,show dramatic contrast differences that are representative of elemental heterogeneity.
Although single-angstrom resolution is possible,practical SEMimage resolution is limited to ³100Å(³0.1µm for X-ray images).These limits depend not only on instrument performance but also on operator acuity.Resolution is optimized under the following conditions:minimum working distance,high accelerating voltage,excellent grounding,excellent mechanical alignment,excellent electronic alignment,minimum incident spot diameter,minimum final aperture diameter,and cleanest column conditions.Sample preparations can be viewed in a variety of orientations and detector modes.Often the examination of a specimen at an oblique angle reveals features unobserved by an electron beam normal to the surface.This is especially true of specimens that have flat,featureless surfaces or that are poor conductors,e.g.,glass surfaces.The PEaccelerating voltage can be varied to change the PEpenetration depth.This procedure is useful for characterizing specimens that are laminated or otherwise heterogeneous between surface and bulk content.
Coating a sample allows observation of a specimen's topography,undisturbed by flare and distortion caused by thermal effects and insufficient grounding.Coatings such as gold,gold–palladium,and carbon are often used because they are highly conductive,easy to apply,and relatively inert.Either evaporation or sputter-coating systems can be used to apply metal films;carbon films must be evaporated.Metal coatings give superior resolution,although their fluorescence can interfere with elemental analysis.Specimen charging affects not only image quality but also X-ray fluorescence yield.
X-ray Emission Analysis—
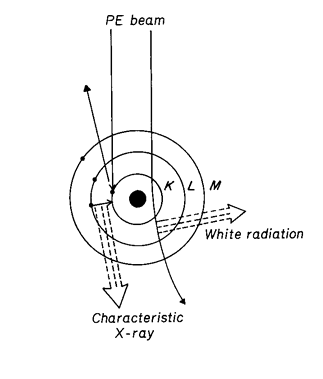
When a PEencounters an orbital electron in an atom,the resultant collision can either promote that orbital electron to a higher energy level or ionize the atom.Stabilization of an atom by relaxation of a higher energy electron to fill a vacancy results in the emission of an X-ray photon.These X-ray energies are discrete and element-specific;they equal the differences between the shell electron energies for the various shells of a given element.For instance,an ejected K-shell electron can be stabilized by a higher energy L-shell electron,yielding a net energy (EL-EK),which is specific for the X-ray photon energy of the elemental Kline.X-ray emission lines are classified according to the electron shell in which the vacancy existed,e.g.,K,L,M.The lines are further categorized according to the shell from which the relaxing electron originates.Thus,a KaX-ray line arises from a vacancy in a K-shell that is filled from an L-shell;a KbX-ray line arises from a K-shell vacancy filled from an M-shell,and so on (see Fig.3).
Since each shell above Kpossesses a number of energy levels,electron transitions yield a number of lines,such as Ka1,Ka2,Kb1,and Kb2.The existence of several X-ray emission lines for each element (a few for Z£11and many for Z³11)is useful in overcoming detection problems due to (1)interelement spectral interferences,e.g.,titanium Kaand barium La,(2)sample matrix effects on energy or intensity,and (3)insufficient PEenergy to excite some elemental lines,e.g.,lead,Klines.
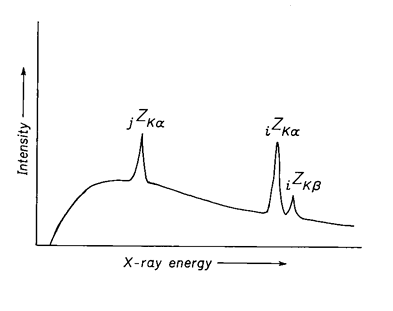
The energies normally encountered in a SEM/EDX(or WDS)analysis range from 0.28keV(»447nm)for carbon Kato the upper end of the instrument accelerating voltage,typically £40keV(£1nm).The natural line width,which is inversely proportional to the lifetime of the upper electronic state,is governed primarily by the transition probabilities for X-ray emission and Auger electron emission.Interaction of X-ray photons with electrons within the specimen can result in Compton scattering to produce a broadened line shifted to lower energy.X-ray photons are also emitted as a result of inelastic acceleration of electrons by atomic nuclei within a specimen.These X-ray photons,termed bremsstrahlung or white radiation,have a broad,continuous energy distribution;and their characteristic lines are superimposed on this background signal.
For lighter elements,Z£11,the low-energy X-ray photons originating from K-shell transitions can be detected only with wavelength-dispersive spectrometers or specially configured energy-dispersive detectors.All other elements emit easily detectable X-ray photons.Heavier elements,Z³16,emit two or more detectable lines corresponding to K-and L-shell transitions;and Z>57emit three or more detectable lines corresponding to K-,L-,and M-shell transitions.For a given element,X-ray intensities generally vary as follows:Ka>Kb>La>Lb,etc.(see Fig.4).
The elemental content of a sample has a bearing on the selection of conditions for analysis.The most useful range of accelerating voltage is @3to 20kV;most elements of interest can be ionized by electrons with energies in this range.The energy required in order to excite X-ray emission from a given line is termed its critical excitation potential.The critical excitation potential for a Kline can be approximated by the sum of the primary line energies (Ka+La+Ma).Selection of an accelerating voltage equal to 1.5times this sum is usually sufficient for semiquantitative analyses.For example,copper has Kaat 8.05keV+Laat 0.93keV=8.98keV:1.5×8.98keV=13.47keV.Selection of 15-kVaccelerating voltage yields sufficient energy to ionize the K-shell of copper atoms and generate a useful analytical signal.
Interelement interferences originate from many effects.High-energy X-rays emitted from heavy atoms can ionize lighter elements to produce secondary X-ray emission from the lighter species.Lower high-Zelement fluorescence and higher low-Zelement fluorescence can be observed,in contrast to that expected from the PE-induced signal of a pure element.Conversely,X-ray emission from a light element may be absorbed by a heavier matrix to yield a negative bias in the light-element signal.These effects always exist in heterogeneous specimens and must be corrected for during any quantitative analysis.Acommon algorithm,ZAF,may be used to correct for Z-dependent interferences due to absorption and secondary X-ray emission.
APPARATUS
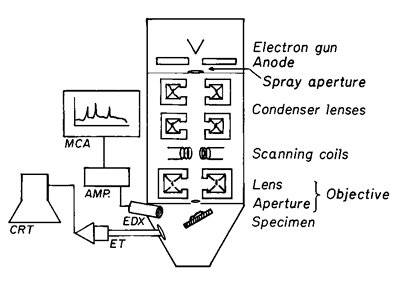
The SEMsystem consists of three electronic groups:(1)illumination,(2)optics,and (3)scanning control-display (see Fig.5).
The image is produced by mapping a specimen with an incident electron beam,rastered in a two-dimensional array.The electron beam is generated by emission from one of three types of sources,listed in order of increasing current density,vacuum requirements,and cost:(1)a tungsten filament cathode,(2)a LaB6cathode,or (3)a field emission gun.By far the most common SEMsource is the tungsten filament,although the high current density of the LaB6source is especially useful where high resolution or detection of low-Zelements is required.
The optics consist of condenser and objective lenses,in conjunction with selected apertures.The size of the final aperture controls the beam diameter and,accordingly,the image resolution and total current at a specimen.Selection of an objective aperture is an important choice.Small apertures are required for high resolution and large apertures provide high current for optimal X-ray emission intensity.In many systems,the objective aperture can be adjusted during use with a sliding or rotating holder.Flexibility in trading resolution for specimen current is also important because sample characteristics affect these two criteria differently.This feature is beneficial to users requiring high magnification and elemental detection,especially of Z£11elements.
Image magnification is controlled by altering the area of the electron beam raster;smaller areas yield higher magnification,because the cathode-ray tube (CRT)area remains constant.An Everhart-Thornley (ET)detector is used for electron detection;the resultant images are most similar to those of reflected light microscopy.An ETdetector consists of a Faraday cage and a scintillator disk connected by a light pipe to a photomultiplier tube.The Faraday cage serves three functions:(1)at positive bias it attracts SE;(2)at negative bias it repels SEto enable the ETdetector to collect BSEsignals alone;and (3)it shields the PEbeam from the scintillator potential.Various scintillator coatings are used.For example,phosphorus-based coatings yield intense,high-contrast images.Aluminum-based coatings,although less sensitive,can withstand the high SEflux generated during elemental analyses.Solid-state detectors provide up to 10times greater sensitivity for BSEcollection.They can be placed at a variety of positions and distances with respect to a specimen.
Procedure
Preparation—
Samples for analysis are easily prepared,especially with an optical aid or a stereomicroscope.
Particles—
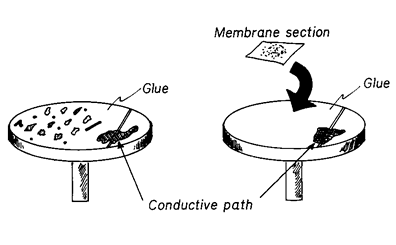
Place isolated or selected particles onto the SEMsample substrate (e.g.,a pyrolytic carbon or metal pedestal).In all cases,the specimen should be attached to an exposed area of the substrate with a suitable liquid cement*(see Fig.6).
Use silver or carbon paint to provide a conductive path between the cement surface and the substrate.Asingle preparation can accommodate from one to several hundred particles,placed in an identifiable pattern.
Particles isolated from liquid samples by membrane filtration can be examined by placing a filter membrane on a sample substrate,as described above (see Fig.6).This preparation is especially useful for examining a random sample of particles from a liquid.Membrane or film filters rather than depth filters are recommended,since small particles are easily lost in the open pores of a depth filter.Portions of a random isolate can be used for the SEMexamination,and the remainder can be saved for other tests.Alternatively,particles can be dispersed in a solvent and concentrated onto a substrate.If a membrane filter is precoated and used to collect particles,a sample can be examined directly without further coating.This procedure alleviates excessive handling of a specimen and lessens exposure of the specimen to coater (sputter or evaporation)environments and to background conductive film signals.
Bulk Materials—
Scatter a loose powder over double-sided sticky tape on a substrate;excess material can be blown off with a clean air jet.Liquid adhesives can be used instead of tape.However,rapid filming of an adhesive surface can occur and can hinder particle adhesion.Also,particles may sink into an adhesive before it dries.Pack loose powder into small holes cut into the surface of a metal pedestal.This technique is favored for semiquantitative analyses because it produces a relatively flat surface,is for practical purposes infinitely thick to the electron beam,provides effective grounding,and requires a minimal amount of sample.
Cement or clamp large materials directly onto the mounting substrate.Nearly any sample that will fit into a vacuum chamber,withstand evacuated conditions,and be effectively grounded is amenable to analysis.For all the above methods,specimen coating is required.In the absence of coating,a preparation must be viewed at sufficiently low energies,usually £5kV,to yield suitable micrograph quality.
Analysis—
The method of probing each particle and obtaining a composition is dependent on the level of information required.Several factors must be considered if semiquantitative analysis is desired.The presence of multiple elements,the type of elements contained in the specimen,and the size and surface characteristics of each particle are a few of the considerations.
Any specimen ³10µm in diameter can be probed quickly and without subsequent data reduction.Particles between 10µm and 0.2µm must be considered more carefully,since their size approaches that of the excitation volume of the probe.Elemental characterization of a particle should be conducted on a specimen sufficiently thick that the particle volume is equal to or greater than the volume of X-ray production.Depth of signal excitation (dX)determines the volume of X-ray production.Conditions such as accelerating voltage,source current,and spot size that are appropriate for analyzing a given specimen volume can be determined empirically,if particles are mounted on a metal substrate from which fluorescence can be detected.Substrate fluorescence indicates that the excitation volume has exceeded the volume of the particle.Quantitatively,dXdepends on particle characteristics and SEMconditions as follows:
where dXis the depth of signal excitation,Zaveis the average atomic number,Aaveis the average atomic mass,EOis the energy of incident electrons,ECis the critical excitation energy of the measured X-ray line,and dis the density of the particle.
Elemental content is estimated directly from elemental line intensities.Use the following procedures.
(1)Mount the specimen(s)by any of the above procedures and ensure good electronic and physical alignment of the SEM.
(2)Tilt or align the specimen toward the detector window at an angle that optimizes collection of the X-rays,i.e.,45 for horizontal detectors.
(3)Select the symmetrical center of the particle and use the raster mode,rather than the point mode,for the analysis.This eliminates topographical variations and generates an average signal for the sample.Choose a magnification at which the raster is @50%of the particle area to eliminate background signal from the substrate.
(4)Adjust the accelerating voltage to produce adequate signal-to-noise for detection of the element of choice.
(5)Integrate the signal as long as necessary to achieve statistically significant results.This period can be determined through analysis of reference materials using the SEMconditions of choice (40seconds per particle is a good working rule).
(6)Ensure sufficient specimen current.Agood working rule is 20%to 40%dead time,as measured by the detector multichannel analyzer (MCA).
(7)Subtract a background spectrum that is representative of the coating,chamber,and handling.
(8)Perform an analysis,using exactly the same conditions as above on a reference standard that contains the element of choice.
(9)Perform an analysis,using exactly the same conditions as above on an internal reference (such as the substrate or other metal),for use in normalizing the analytical conditions.
The weight percent of a given element (E)in the specimen can be calculated as
where IEis the intensity of the element of interest,Irefis the intensity of the internal reference element,and CEstdis the concentration of the element of interest in the standard specimen.More accurate quantitative analysis must take into account the effects of matrix type,of interelements,of counting times,and of takeoff angle.The ZAFalgorithm used to correct for these effects involves multiplying the measured weight percent by a series of correction factors.
*
Any “superglue,”copper diallylphthalate,double-sided sticky tape,or other types of mounting resins can be used.The cement with the least residual organic phase will have the longest stability.
